

Measuring the ROI of your local SEO efforts means tracking specific, conversion-driven actions like direction requests, phone calls, and form completions, not just rankings or traffic numbers. Most local business owners stop at impressions and keyword positions. That approach misses the metrics that actually connect to revenue. The industry standard for evaluating local SEO return on investment combines spatial visibility scoring, call attribution via Dynamic Number Insertion, and conversion rate analysis. When you tie those signals together, you get a number you can defend to any stakeholder.
Which metrics most accurately reflect local SEO ROI?
Conversion-focused metrics are the most reliable signals for measuring local SEO ROI. Impressions tell you how often your listing appeared. They do not tell you whether anyone walked through your door.
The metrics that actually matter fall into three categories.
- Direction requests. Direction requests are the strongest signal of foot traffic intent available in Google Business Profile data. A sustained spike in direction requests correlates directly with increased physical visits, provided your listing address is accurate.
- Inbound calls. Calls tracked through Dynamic Number Insertion (DNI) isolate SEO-driven phone inquiries from calls generated by paid ads, social media, or direct referrals. Without DNI, you cannot accurately attribute a call to local SEO.
- Form completions and website leads. Website-to-lead conversion rates for local service businesses typically range between 5% and 15%, depending on industry and website quality. That range gives you a realistic multiplier when estimating leads from organic traffic.
- Discovery queries vs. branded queries. Google Business Profile separates searches by type. If 70–80% of your visibility comes from branded searches, your SEO is reinforcing existing demand rather than capturing new customers. True ROI growth shows up in rising discovery query volume.
Total impressions and overall ranking positions are the weakest ROI indicators. They measure exposure, not intent. Prioritize calls, direction requests, and lead conversions when you assess local SEO impact.
Pro Tip: Set up a separate tracking phone number for your Google Business Profile using a DNI service. This single step eliminates the most common attribution error in local SEO reporting.

How to use grid-based visibility tracking to measure local SEO success
Single-point rank tracking reports your position for one keyword at one location. That number is almost meaningless for a business serving a geographic area. Grid-based local rank tracking solves this by mapping your rankings across dozens of points within your service area.
Here is how the method works:
- Set the grid. A standard 13×13 grid places 169 data points across your service area, typically covering a 10km radius from your business location. Each point represents a unique geographic position where a potential customer might search.
- Record rankings at each point. The tool checks your Google Business Profile ranking for a target keyword at every grid point. You get a visual map showing where you rank in the top three, positions 4–10, and below.
- Calculate your visibility score. Divide the number of grid points where you rank in the top three by the total number of points (169). Multiply by 100. A score of 35% means you appear in the top three results for 35% of your service area.
- Estimate potential customer exposure. Multiply your visibility score by the estimated monthly search volume for your keyword in that area. This gives you a rough figure for how many searchers can realistically find you.
- Track changes over time. Run a new grid scan after each optimization cycle. The shift in visibility score is your primary performance indicator.
| Visibility score | Estimated top-3 grid points (of 169) | Interpretation |
|---|---|---|
| 20% | 34 | Weak local presence, high growth potential |
| 35% | 59 | Average coverage for most local markets |
| 58% | 98 | Strong presence, competitive positioning |
| 75%+ | 127+ | Market leader in the service area |
Combining visibility data with conversion rates transforms a grid score from an abstract number into an estimated revenue figure. That connection is what makes grid tracking worth the effort.
Pro Tip: Run your baseline grid scan before making any changes to your Google Business Profile or website. Without a clean before snapshot, you cannot calculate a meaningful ROI percentage later.
Step-by-step local SEO ROI calculation using grid data
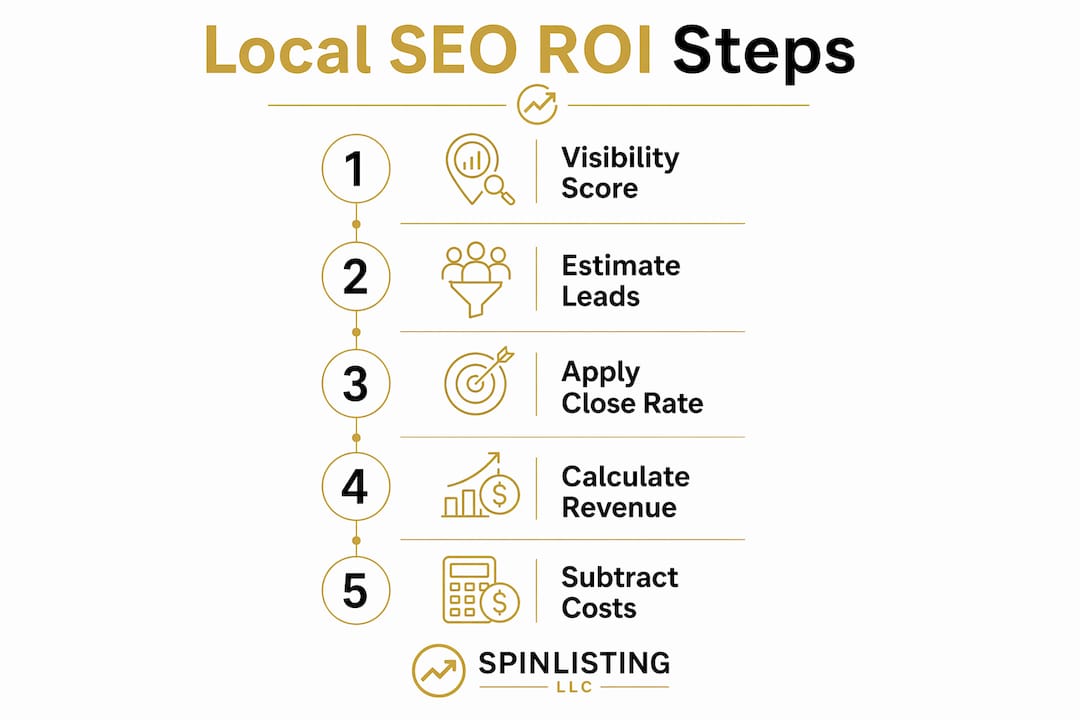
This method combines visibility scores, click-through rates, conversion rates, and average customer value into a single ROI figure. Follow these steps in order.
- Establish your baseline. Run a grid scan and record your current visibility score. Pull 90 days of Google Business Profile data for calls, direction requests, and website clicks. This is your starting point.
- Estimate monthly clicks. Multiply your visibility score by the estimated monthly search volume for your primary keyword. Then apply a realistic click-through rate. Top-three Google Business Profile listings typically earn a higher click-through rate than lower positions, so use a conservative estimate based on your current average position.
- Convert clicks to leads. Apply your website-to-lead conversion rate. If your site converts at 8% and you estimate 200 monthly clicks from local SEO, that equals 16 leads per month.
- Calculate revenue from leads. Multiply monthly leads by your average customer value. If each new customer is worth $400 and you close 40% of leads, 16 leads generate roughly $2,560 in monthly revenue.
- Factor in SEO costs. Subtract your monthly SEO spend from the revenue figure. If you pay $600 per month for local SEO services, your net monthly return is $1,960.
- Compute the ROI percentage. Use the standard formula: (Net Return / Cost) x 100. In this example: ($1,960 / $600) x 100 = 327% ROI.
- Repeat after each optimization cycle. An increase in visibility from 35% to 58% translates into a proportional increase in estimated clicks, leads, and revenue. Comparing before and after figures gives you a concrete ROI story.
| Step | Input | Example value |
|---|---|---|
| Visibility score | Grid scan result | 58% |
| Estimated monthly clicks | Visibility x search volume x CTR | 200 |
| Monthly leads | Clicks x conversion rate (8%) | 16 |
| Monthly revenue | Leads x close rate x customer value | $2,560 |
| Net ROI | (Revenue minus cost) / cost x 100 | 327% |
Pro Tip: Use Google Analytics 4 with UTM parameters on your Google Business Profile website link. This separates organic local traffic from direct and paid traffic, making your conversion data far more accurate.
What tools do you need to track local SEO performance?
Standard analytics tools alone cannot accurately attribute local SEO success. You need a combination of specialized tools working together.
- Google Business Profile Insights. This is your starting point for calls, direction requests, and website clicks. Filter by discovery queries to isolate new customer activity from branded searches. Calls, bookings, and direction requests tied to discovery queries reveal true SEO-driven engagement.
- Dynamic Number Insertion (DNI) services. DNI swaps the phone number on your landing page based on traffic source. A visitor arriving from Google organic search sees a different number than one arriving from a paid ad. This isolates SEO-driven calls with precision.
- Grid-based rank tracking tools. These tools generate the spatial visibility maps described above. They are the only way to measure ranking performance across a full service area rather than a single location.
- Google Analytics 4 with UTM parameters. Tag your Google Business Profile website link with UTM parameters (source: google, medium: organic, campaign: gbp). This routes local SEO traffic into its own segment in GA4, making conversion tracking far cleaner.
- Unified reporting dashboards. The most useful setup combines call data, grid visibility scores, and website conversion data in one view. This lets you spot correlations between ranking improvements and lead volume without switching between platforms.
Understanding your local search market share alongside these tools gives you competitive context for interpreting your visibility scores.
Common mistakes when measuring local SEO ROI
Most measurement errors come from tracking the wrong things or missing a key data source. These are the mistakes that produce misleading ROI figures.
- Relying on total impressions. Impressions measure how often your listing appeared, not whether anyone acted. A business with 50,000 monthly impressions and zero direction requests has no measurable ROI.
- Ignoring branded vs. discovery segmentation. Mixing branded and discovery queries inflates your apparent SEO performance. Segmenting these two query types is the only way to see whether your SEO is actually expanding your reach.
- Skipping call tracking. Without DNI, every call looks the same regardless of source. You cannot calculate ROI from calls if you cannot attribute them to a channel.
- Ignoring offline data. Bridging digital signals with offline business outcomes is one of the hardest parts of local SEO measurement. Integrating foot traffic trends, booking data, and lead qualification results narrows the gap significantly. Sustained increases in direction requests correlate with local foot traffic trends, which strengthens your confidence in the ROI figures you report.
- Treating conversion rates as fixed. A 5% conversion rate in january can drop to 3% in july for a seasonal business. Apply period-specific rates when calculating ROI for different months.
Accurate local SEO ROI measurement requires consistent, granular tracking from day one. Retroactive data collection almost always produces gaps that undermine your analysis.
Pro Tip: Review your Google Business Profile listing accuracy every quarter. Incorrect address or phone data corrupts direction request and call attribution data, which breaks your entire ROI model.
Key takeaways
Accurate local SEO ROI measurement requires combining spatial grid visibility scores, DNI call tracking, and conversion rate analysis to produce revenue estimates you can defend.
| Point | Details |
|---|---|
| Prioritize conversion metrics | Track direction requests, inbound calls, and form completions rather than impressions or total rankings. |
| Use grid-based visibility scoring | A 13×13 grid with 169 points gives you a percentage score that maps directly to customer exposure across your service area. |
| Apply the ROI formula | Multiply visibility-driven clicks by your conversion rate and customer value, then subtract SEO costs to get a real ROI percentage. |
| Segment query types | Separate discovery queries from branded searches to measure true new-customer reach from your SEO investment. |
| Combine tools for accuracy | DNI call tracking, Google Analytics 4 with UTM parameters, and grid rank trackers together produce attribution data that standard analytics cannot. |
Why I stopped trusting single-point rankings years ago
The shift from single-point rank tracking to grid-based visibility scoring changed how I think about local SEO performance entirely. Early in my career, I reported keyword positions to clients as if they were the whole story. A business ranking number one for its main keyword felt like a win. Then I started mapping those rankings spatially and realized the business ranked number one at its front door and number nine three miles away. The customer three miles away never found them.
Grid visibility scores tell a story that clients actually understand. When you show someone a map of their service area colored by ranking position, they immediately see the gaps. That visual proof is more persuasive than any spreadsheet of keyword positions.
The other shift I made was integrating offline signals. Direction requests and call volume are useful, but pairing them with actual booking data or foot traffic counts makes the ROI case airtight. Local businesses live and die by physical visits. Any measurement framework that stops at the click is incomplete.
My practical advice: start with a grid baseline scan and a DNI call tracking setup before you touch anything else on the profile. Those two steps give you the before data you need to prove results later. Without them, you are reporting improvements with no baseline to compare against. That is not measurement. That is storytelling.
— Against
Spinlisting helps you track and prove your local SEO results
Local SEO ROI is only provable when you have the right data from the start. Spinlisting specializes in Google Business Profile optimization that sets up your listing to generate the direction requests, calls, and discovery query traffic that feed a real ROI calculation.

Spinlisting’s approach combines profile accuracy, keyword-focused listing updates, and ongoing performance monitoring so you always have clean data to work with. Clients have seen 83% increases in first-place rankings after working with Spinlisting, which translates directly into higher visibility scores and more measurable leads. If you want local SEO results you can actually quantify, Spinlisting gives you the foundation to do it.
FAQ
What is the best metric to measure local SEO ROI?
Direction requests and inbound calls tracked via Dynamic Number Insertion are the strongest ROI indicators. They signal real customer intent and connect directly to physical visits and revenue.
How do I calculate ROI from local SEO?
Multiply your estimated monthly SEO-driven leads by your average customer value and close rate, then subtract your SEO costs. Divide the net return by your costs and multiply by 100 to get your ROI percentage.
What is a good website-to-lead conversion rate for local SEO?
Local service businesses typically convert between 5% and 15% of website visitors into leads. The exact rate varies by industry, website quality, and how well the page matches search intent.
Why does grid-based tracking matter for local SEO measurement?
A single keyword ranking only reflects your position at one geographic point. A 13×13 grid with 169 data points shows your visibility across your entire service area, giving you a far more accurate picture of customer exposure.
How do I separate SEO-driven calls from other sources?
Dynamic Number Insertion (DNI) assigns a unique phone number to visitors arriving from each traffic source. This isolates calls generated by local SEO from those coming from paid ads, social media, or direct referrals.
Recommended
- Local Online Marketing Budget Tips for Small Businesses | Google my Business for SEO / ranking services SEO
- Local Search Market Share: What Businesses Must Know | Google my Business for SEO / ranking services SEO
- Local SEO vs Paid Ads Explained for Business Owners | Google my Business for SEO / ranking services SEO
- GMB SEO Rankings | Local SEO + Chat GPT | Spinlisting